


 intra.librelab.org

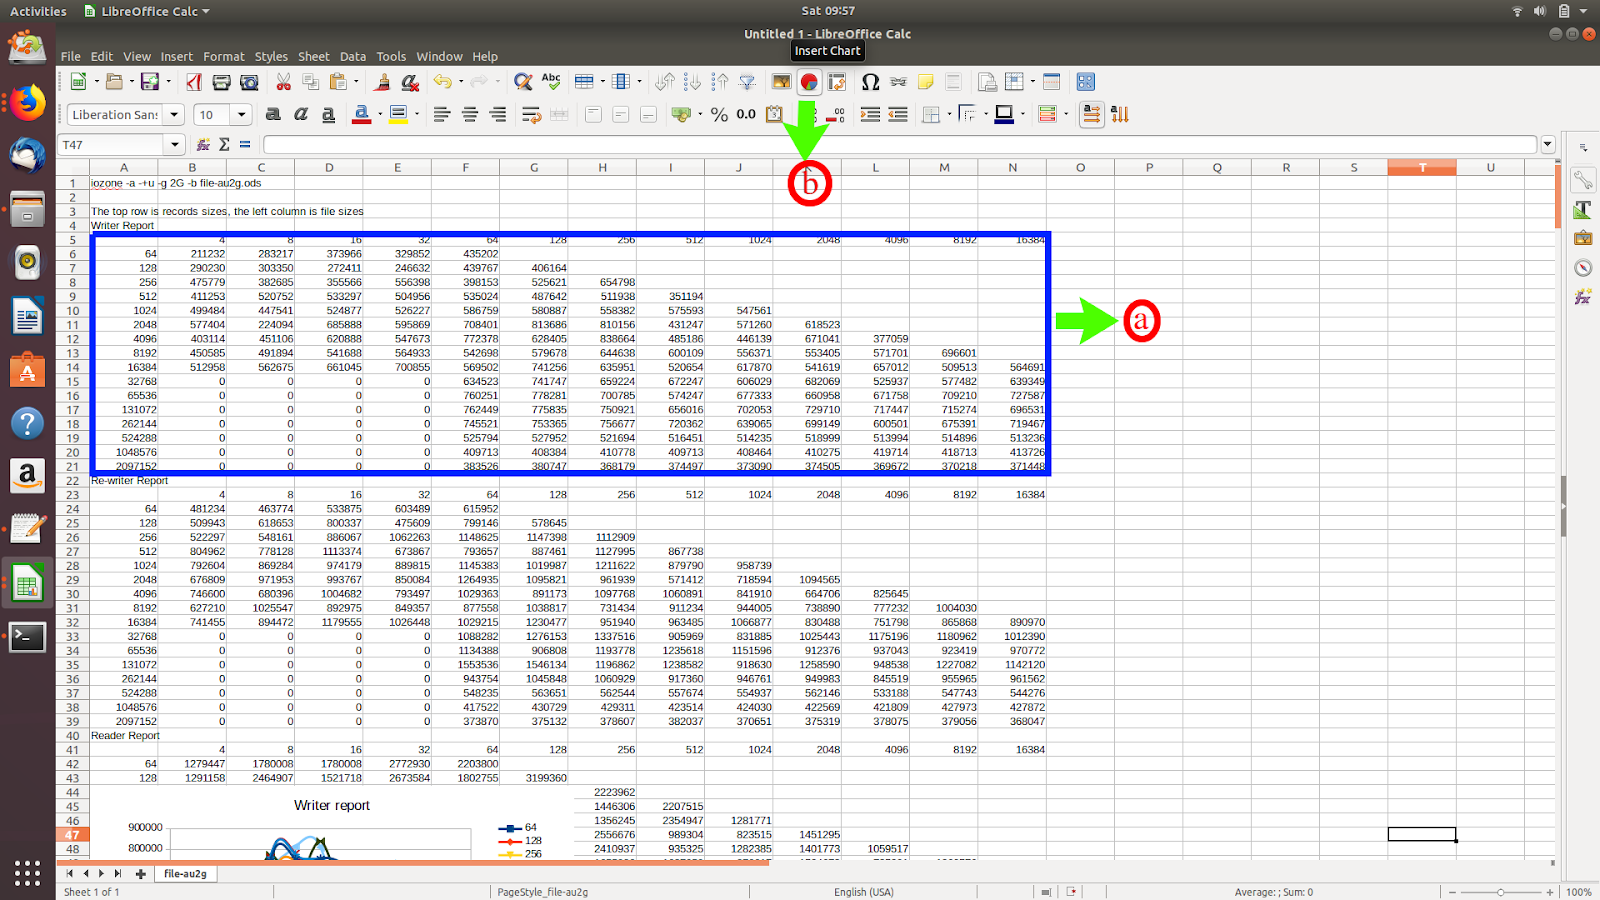
Output of the command
provides benchmark on the filesystem(ext4) which includes various reports namely
writer report
re-writer report
reader report and others
This (howto)graph is generated for only writer report

a Data range used
b select insert chart

In the chart wizard, selected line(c) and line type-> smooth(d)(its your choice what kind of chart you want)

Select e to define the data range

Select the data range f which gets reflected in g

Graph takes its form

No need to fiddle with data ranges and data series

Enter the title, x axis and y axis label

The final output

**Image edited with pinta
iozone -a -+u -g 2G -b file-au2g.ods
provides benchmark on the filesystem(ext4) which includes various reports namely
writer report
re-writer report
reader report and others
This (howto)graph is generated for only writer report

a Data range used
b select insert chart
In the chart wizard, selected line(c) and line type-> smooth(d)(its your choice what kind of chart you want)

Select e to define the data range

Select the data range f which gets reflected in g

Graph takes its form

No need to fiddle with data ranges and data series

Enter the title, x axis and y axis label

The final output

**Image edited with pinta


